OK, So I'm a total geek. I was curious as to what the bell curve looked like for all of the DP Challenges (as of 11/1/2005).
So, I had a friend help me out, and using some shell scripts, cURL I was able to grab all the average vote values for each photo in all of the challenges so far.
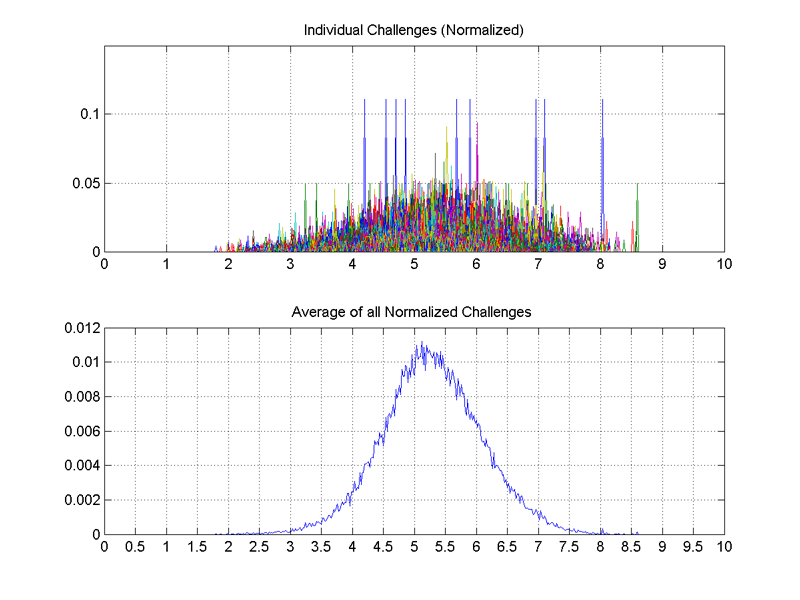
Then, using some scripts forMATLAB, I was able to create a histogram of the votes for each challenge, shown in the top graph below. Each of the histogram bin values were divided by total number (not value) of challenge votes so each histogram could be ploted using the same vertical scale. Then, using this dataset, I created a plot of the average (lower plot below).